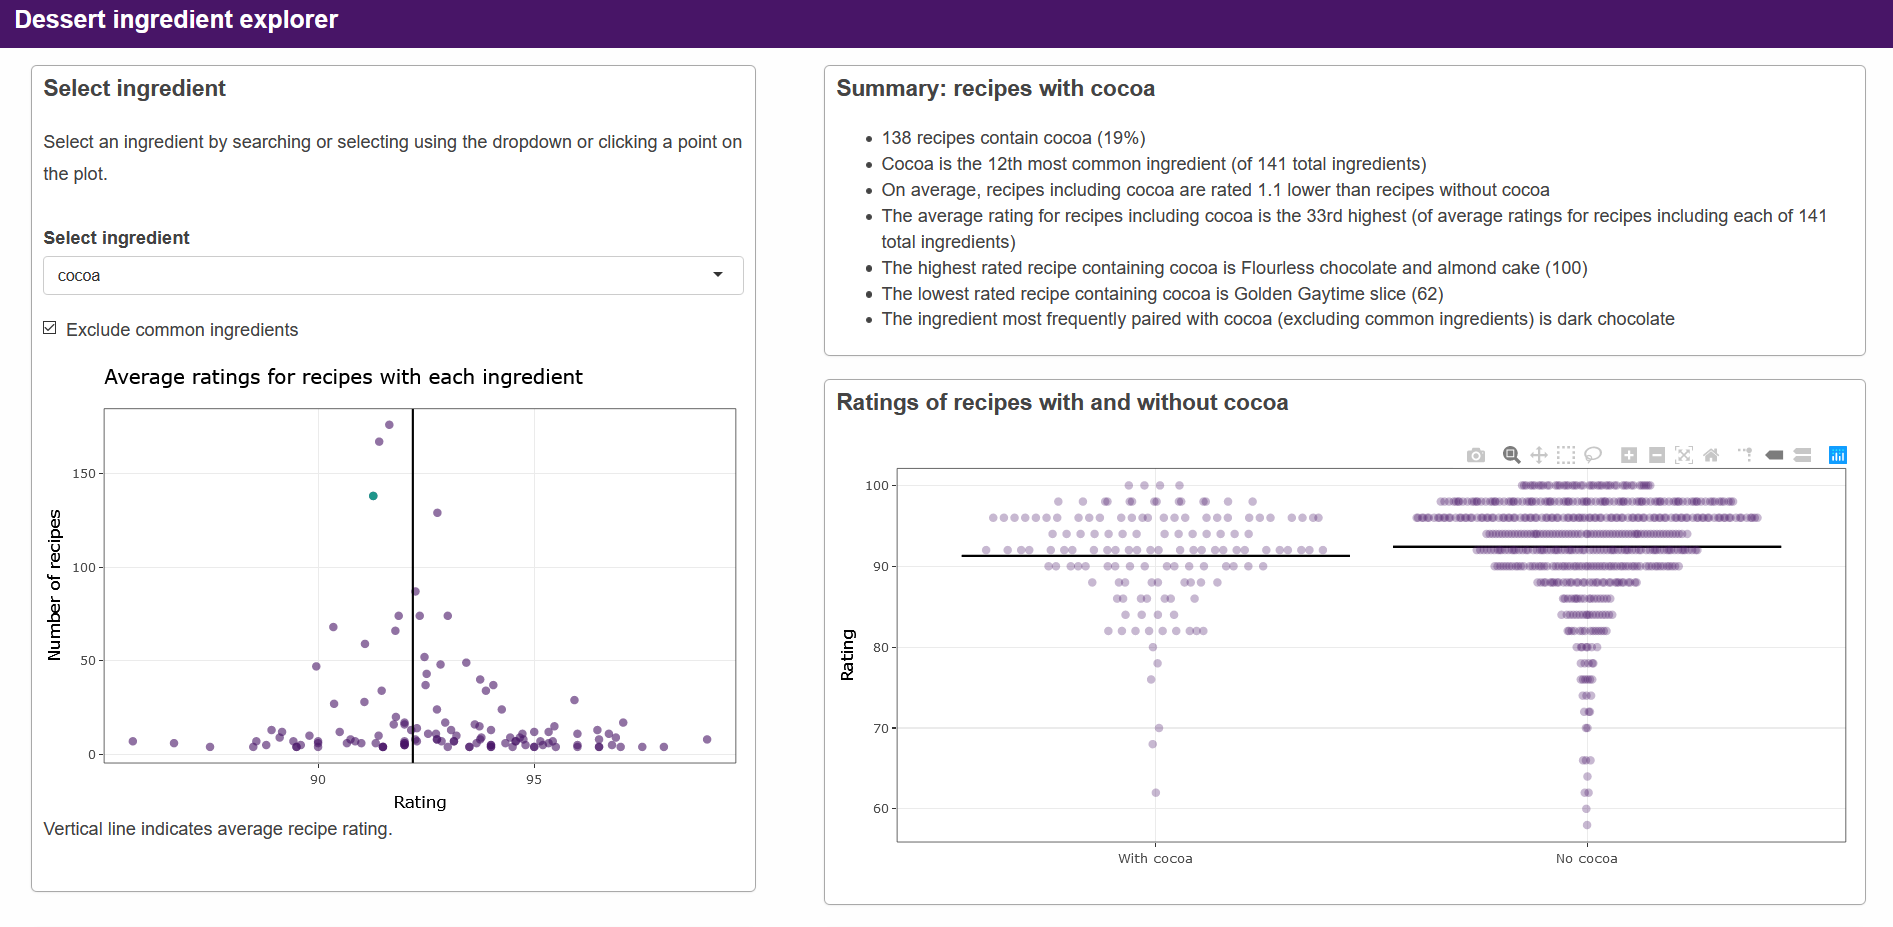
To follow up my two previous posts where I analysed ingredient lists and ratings for dessert recipes, I decided to make a Shiny app to explore the data interactively. You can find the app here.
(As a quick aside, to deploy my Shiny app on AWS I relied heavily on Charles Bordet’s excellent and comprehensive guide.)
You can select an ingredient either by clicking a point on the plot or by selecting it from the dropdown. This will show you a summary of the ingredient (such as how many recipes it’s included in, average rating for recipes with that ingredient, and the most common ingredient it’s paired with).

Screen shot of ingredient explorer app showing information about the selected ingredient
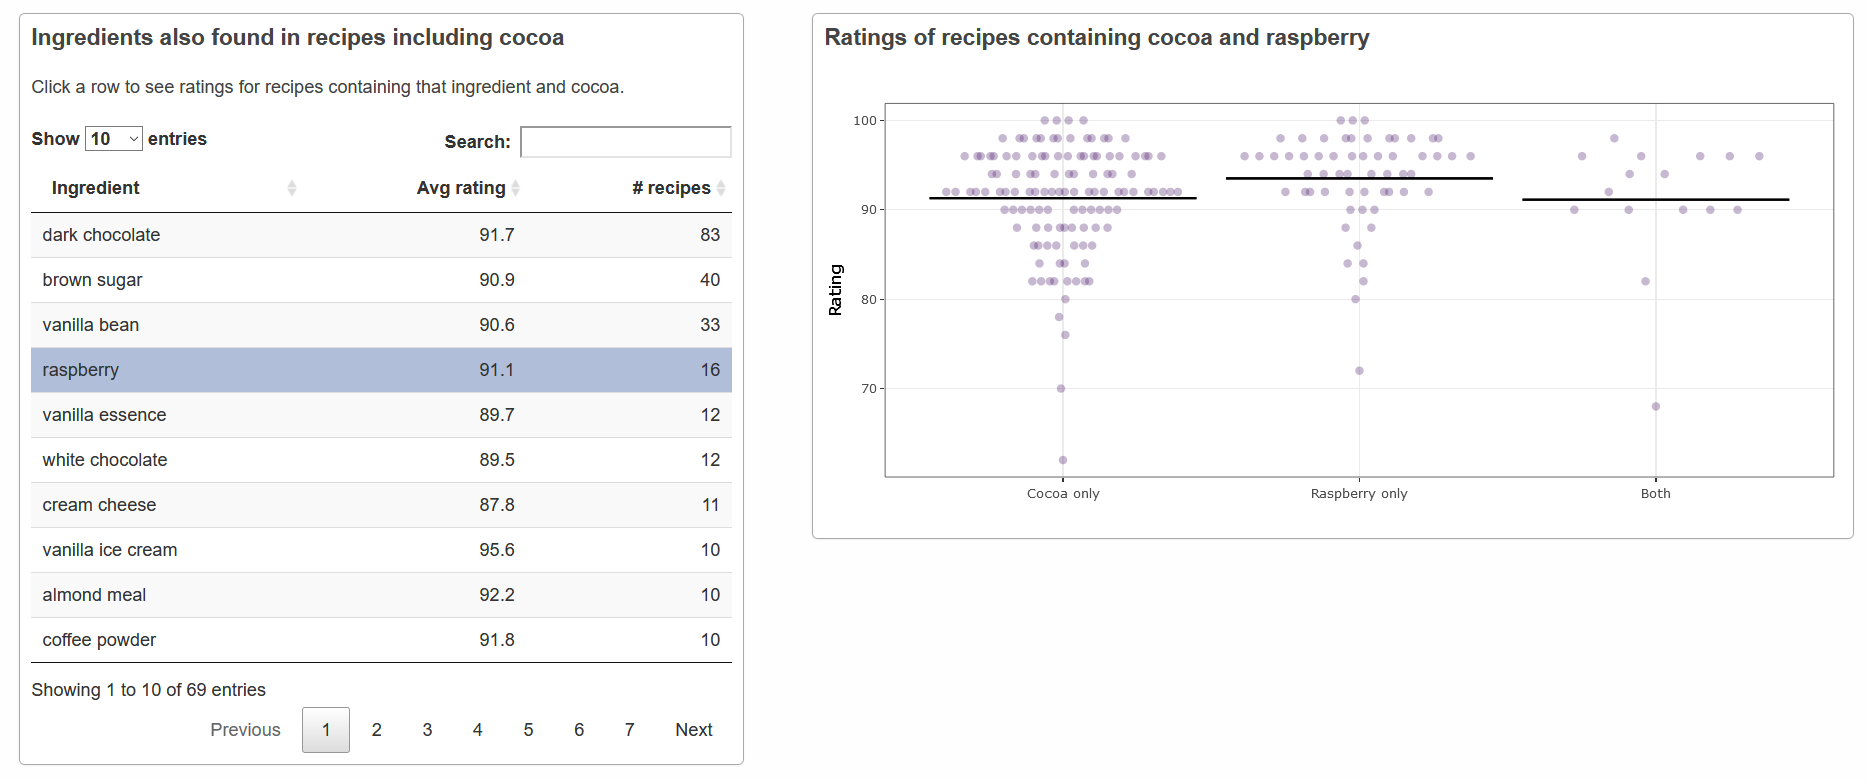
The app also allows you to explore which other ingredients are also included in recipes containing the selected ingredient. Selecting an ingredient in the table will display a plot with the ratings for each recipe contain one of the two ingredients or both. Like all plots in the app, you can hover over a point to see more details about it (in this case, the recipe name and rating).

Screen shot of ingredient explorer app showing information about the selected ingredient
You can explore the dessert recipe explorer app for yourself here. All the code for this project can be found in my GitLab. Enjoy!